How to use the Azure Application Insights tile
The Azure Application Insights tile allows you to query Application Insights for data and display that information on your Dashboard Server dashboard.
The ability to render information as a graph is a feature of the Azure portal rather than the App Insights Query language itself. At this time any queries run using the render statement will still return tabular or scalar data rather than graphs, depending on the tile.
How to configure an Azure Applications Insights tile
You need to have an Azure Applications Insights provider before you can configure an Azure Application Insights tile. If you haven't created a provider yet, see How to add an Azure Application Insights provider.
Add a new tile to a dashboard and choose the
Azure tile.
Choose the visualization for your tile.

 Scalar
A single value such as a number of customers or incidents.
Example:

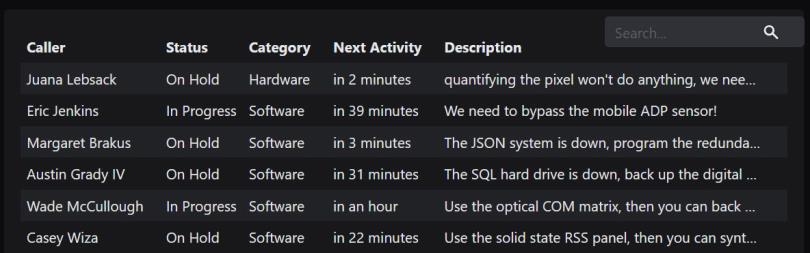
 Grid
GridA table of data, for example incidents or tickets.
Tip: You can turn the individual rows into links in the settings. For example, if you're displaying tickets in your grid, you can link the rows to the ticket in your external ticket system.
Did you know? Since Dashboard Server 5.4 users can search the grid, and temporarily change the column size and sorting of the grid (by clicking on the column headers) without having to access the settings. They can also expand a row by clicking on the three dots at the end of each row if cells are too small to show their entire content.
Provider:
Select your Azure Application Insights provider. If you haven't created a provider yet, see How to add an Azure Application Insights provider.
Query:
The tile uses the query language KQL ("Kusto"). KQL is very rich and offers features such as sorting, projection and calculated values, which you can use to control the display of data in your dashboard.
Check out our GitHub Samples repository for sample KQL queries from the community that can be used in Azure tiles.
For more information about writing KQL queries see this external Microsoft article.
Query tips and examples for GridsExample for a performance information request query for a Grid
Copyrequests
| summarize percentiles(duration, 50, 90, 95) by bin(timestamp, 1h)Tips for Grid queries
Modify your App Insights query to only return the columns you want to display via
projectorproject away. You can hide columns later in the settings, but filtering them directly in the query will improve performance when loading and displaying the tile.Querying multiple (cross-resource) applicationsThe Azure API allows you to send a query to multiple workspaces (for Log Analytics) or applications (for App Insights) simultaneously using implicit and explicit cross-resource unions. The Log Analytics and the App Insights tile support both mechanisms, with implicit being easier but explicit offering more control over how data is returned.
Regardless of which mechanism you use, you may only query across 10 apps (for App Insights) or 10 workspaces (for Log Analytics) with a single cross-resource query (and therefore a single tile), and the provider's configured app is always used.
Using implicit Unions
When you use implicit unions, you provide a query to the tile and specify up to 9 other additional workspace/app identifiers. The query is automatically sent to the provider's configured workspace and any others you specify, and the output joined together in a single result for further processing. To configure an implicit cross-resource query:
For Azure Log Analytics tiles: In the query panel click add under additional workspaces.
For Azure App Insights tiles: In the query panel click add under additional applications.
Enter an identifier for your workspace/app (using any of the formats given below) and press enter or deselect the text box.
Either repeat the process by clicking add again and adding additional workspaces/apps, or click next and continue to configure the tile.
Using explicit Unions
In contrast to implicit unions, explicit ones are specified directly within your query using the
Unionstatement, and allow you to pull in a specific subset of the data in the other workspaces/apps. For further information check out this Azure blog post on Querying across resources.For Azure Log Analytics tiles:
The example below shows results from the provider's workspace, along with only security updates from another namedcontosoretail:Copyunion Update, (workspace("contosoretail").Update | where Classification == "Security Updates" )
| where TimeGenerated >= ago(1h)
| where UpdateState == "Needed"
| summarize dcount(Computer) by ClassificationFor Azure App Insights tiles:
The example below shows results from the provider's app, along with only GET request exceptions from another namedcontosoretail:Copyunion exceptions, (app("contosoretail").exceptions | where operation_Name contains "GET" )
| summarize count() by problemIdIdentifiers for workspaces
The following methods are supported to identify your workspace/app:
Resource name The human readable name of the resource.
Note: If used this must be unique to all Azure subscriptions the provider has access to or the query will fail as ambiguous.
Qualified name The "full name" of the workspace, in the following format:
For Azure Log Analytics:
<subscriptionName>/<resourceGroup>/<workspaceName>For Azure App Insights:
<subscriptionName>/<resourceGroup>/<applicationName>Note: The qualified name may still be ambiguous as subscription names are not unique, but it is extremely unlikely.
GUID
The GUID (e.g.
b438b4f6-912a-46d5-9cb1-b44069212ab4), which is completely unique and unambiguous.For Azure Log Analytics: The GUID is the Workspace ID
For Azure App Insights: The GUID is the Application ID
Azure Resource ID A string in the following format:
For Azure Log Analytics:
/subscriptions/<subscriptionId>/resourcegroups/<resourceGroup>/providers/microsoft.OperationalInsights/workspaces/<componentName>For Azure App Insights:
/subscriptions/<subscriptionId>/resourcegroups/<resourceGroup>/providers/microsoft.operationalinsights/applications/<applicationName>Note: While the string is unambiguous, it is also extremely long and difficult to work with.
Timeframe:
Here you determine the timeframe for the search query.
The default timeframe is 24 hours, which means the tile will not return any entries older than 24 hours.
Take care when using a long timeframe, as this may pull many thousands of entries and significantly impact browser performance.
If your query doesn't specify a timeframe
Set the time range to the fixed time range you want to use.
If your query specifies a timeframe
If you specify a timeframe in the query (e.g.
where timestamp >= ago(2h)), events must satisfy both the timeframe you set here and in thewhereclause in your query.If you want to control the timeframe using only the query, set the tile timeframe to time range > all.
Note:
This tile always ignores the dynamic page timeframe set by users.
What is the page timeframe?The page timeframe is the timeframe setting a dashboard is currently using. When a user changes the page timeframe, all tiles that use the page timeframe will adapt to the new timeframe. Tiles that don't use the dynamic page timeframe aren't affected and won't change.
Configure the settings for your visualization:
Settings for ScalarsScalar
Font size Allows you to set the font size of the value in the tile.
Unit Allows you to add a unit to the value displayed in the Scalar tile. For example, if your value shows a time in milliseconds, you can enter "ms" or if your value shows pageviews, you can enter "pageviews".
Value formatter Allows you to format the value by using the mustache picker. For example, you can round the value up or down or convert it.
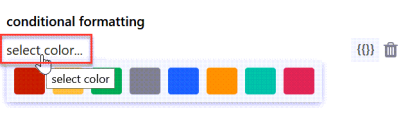
Conditional formatting:
You can display the scalar in different colors based on conditions you defined here. For example, you can display the scalar in green when the value is below 100 and in red when it is above 100.
Click on add to configure a condition.
Click on select color.... to open the color picker. Select the color for this condition.
Enter your condition in the field next to the color. You can use the
valueproperty and manipulate it with JavaScript String and Regex APIs. When you click on the mustache picker, you'll get some examples:Value is greater than something, less than something, etc.
For example:
{{value < 10}}(The color you picked will be used if the value is less than 10)Value is present in the result
For example:
value.IndexOf('error') != -1(The color you picked will be used if the string value "error" is present in the results)Value matches one of the regular expressions you defined
For example:
value.match(/healthy|good|up/)(The color you picked will be used if the string values arehealthy,good, orup)
Display:
Here you decide how the color is used:
Tile background Highlight the tile in the color you defined. Text foreground
Display the text in the color you defined. Link options
Allows you to turn the graph item(s) into links. You can either enter plain text to create a fixed link (URL always stays the same) or use dynamic properties to create a dynamic link.
Dynamic links make use of dynamic properties which are inserted as part of the URL. This creates a template URL that will be resolved to an actual URL based on the items properties.
For example, if you want to link to tickets in your ticket system and the format of the URL for tickets in your system is
https://www.my-system/ticket-123, where123is the ticket ID, you can use the dynamic property that contains the ticket ID and enter the dynamic URLhttps://www.my-system/ticket-{{ticketID}}.For scalars, you can only use the dynamic property
valuein dynamic links, which means the link changes when the value of the scalar changes. Since a scalar is just one item, it would also make sense to use a fixed link, for example the link to the website of which you are displaying the response time.For status icon or bars and the rows of a grid, you usually want to use a dynamic link since you get multiple items or rows that represent different things. You can use any of the dynamic properties the mustache picker offers you.
Examples for URLs with dynamic properties for popular APIsDynamic mustache properties and values you need to change according to your instance are highlighted in bold.
ServiceNow incidents:
https://<your-instance>.service-now.com/nav_to.do?uri=%2Fincident.do%3Fsys_id%3D{{sys_id}}PagerDuty incidents:
{{incident.html_url}}Azure DevOps projects:
https://dev.azure.com/<your-instance>/{{name}}Azure DevOps builds:
https://dev.azure.com/<your-instance>/_build/results?buildId={{id}}Zendesk tickets:
https://<your-instance>.zendesk.com/agent/tickets/{{id}}Azure Application Insights
https://portal.azure.com/#@squaredup.net/resource/{{ResourceId}}Settings for GridsGrid columns
Grid columns opens the grid designer, where you can show or hide columns, change the order of columns, edit column names or add custom columns.
Grid options
Row link Allows you to turn the graph item(s) into links. You can either enter plain text to create a fixed link (URL always stays the same) or use dynamic properties to create a dynamic link.
Dynamic links make use of dynamic properties which are inserted as part of the URL. This creates a template URL that will be resolved to an actual URL based on the items properties.
For example, if you want to link to tickets in your ticket system and the format of the URL for tickets in your system is
https://www.my-system/ticket-123, where123is the ticket ID, you can use the dynamic property that contains the ticket ID and enter the dynamic URLhttps://www.my-system/ticket-{{ticketID}}.For scalars, you can only use the dynamic property
valuein dynamic links, which means the link changes when the value of the scalar changes. Since a scalar is just one item, it would also make sense to use a fixed link, for example the link to the website of which you are displaying the response time.For status icon or bars and the rows of a grid, you usually want to use a dynamic link since you get multiple items or rows that represent different things. You can use any of the dynamic properties the mustache picker offers you.
Examples for URLs with dynamic properties for popular APIsDynamic mustache properties and values you need to change according to your instance are highlighted in bold.
ServiceNow incidents:
https://<your-instance>.service-now.com/nav_to.do?uri=%2Fincident.do%3Fsys_id%3D{{sys_id}}PagerDuty incidents:
{{incident.html_url}}Azure DevOps projects:
https://dev.azure.com/<your-instance>/{{name}}Azure DevOps builds:
https://dev.azure.com/<your-instance>/_build/results?buildId={{id}}Zendesk tickets:
https://<your-instance>.zendesk.com/agent/tickets/{{id}}Azure Application Insights
https://portal.azure.com/#@squaredup.net/resource/{{ResourceId}}Show column headers You can choose between showing or hiding the header for all columns.
Expand rows automatically Activate this checkbox if you want the row height to expand automatically based on the row content, for example if your grid uses increased text size, images, emojis etc.
Limit number of results displayed You can set a limit of the initial number of results displayed in the grid. If you have set a limit and there are more results to display, users will see a "show all" button below the grid.
Font size Use the slider to adjust the font size.
Tip for column sizing: You can change the column width directly in the grid by clicking on the divider lines between columns and dragging them to the width you want. You need to show column headers (by activating the show column headers check box) to be able to change the column width.
Resizing columns while in edit mode affects how the grid looks by default when users open the dashboard. Users can temporarily change the column sizes by dragging them, but those changes only last until they leave the page.Click done to save the tile.
The tile now shows data according to your settings.