How to use the Splunk tile
About Splunk tiles
Splunk tiles offer you an easy way to display data from your Splunk instance in a Dashboard Server dashboard.
A Connect edition license (or above) is required for this feature. To upgrade please contact sales@squaredup.com.
To check the license edition you are using see How to check which license key is being used . To see what is included in different product edition licenses see the Licensing Overview.
How to configure a Splunk tile
If you don't already have a Splunk provider, you need to create one before you can configure a Splunk tile (How to add a Splunk provider).
Add a new tile to a dashboard and choose the Splunk tile.

Select the visualization for your Splunk tile and click next.

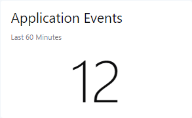
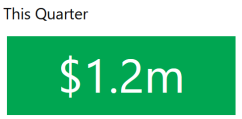
 Scalar
A single value such as a number of customers or incidents.
Example:

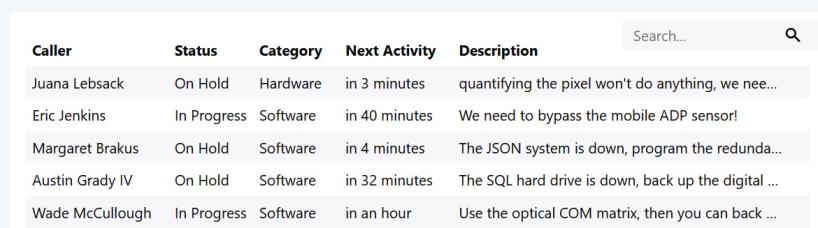
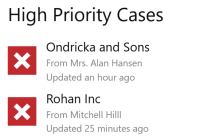
 Grid
GridA table of data, for example incidents or tickets.
Tip: You can turn the individual rows into links in the settings. For example, if you're displaying tickets in your grid, you can link the rows to the ticket in your external ticket system.
Did you know? Since Dashboard Server 5.4 users can search the grid, and temporarily change the column size and sorting of the grid (by clicking on the column headers) without having to access the settings. They can also expand a row by clicking on the three dots at the end of each row if cells are too small to show their entire content.
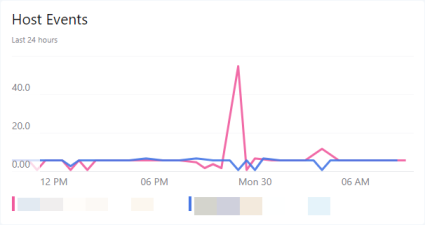
 Line Graph
Shows data over time, in a graph with an x-axis (time) and a y-axis. You can show several objects, such as servers, in one graph.
Example:
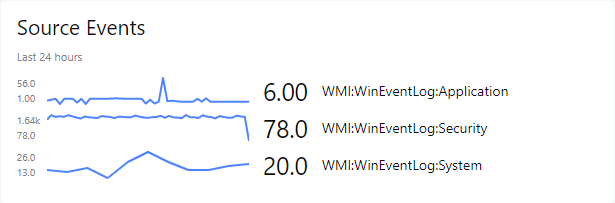
 Sparklines
Shows data over time (like line graphs), but each item gets its own graph instead of showing all lines in one graph.
Example:
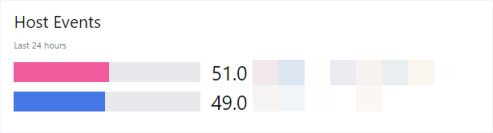
 Bar Graph
Visualizes both a number and the resulting bar width based on the number value.
Example:
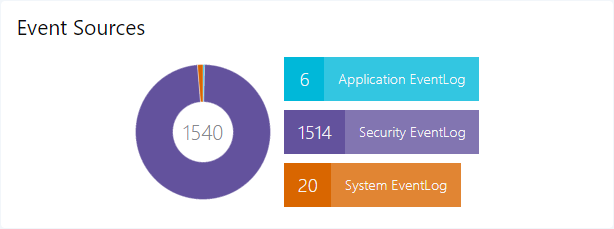
 Donut
DonutShows the results in a donut shape.
Example:
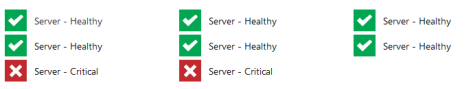
 Status Icons
Shows the state of items as icons with different colors. You can display just the icons or together with a description. You can also use a background image and drag the icons into position on the image.
Example:

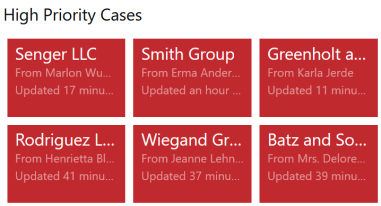
 Status Blocks
Shows the state of items as blocks with different colors.
Example:
Scope:
Select the scope for your tile (optional).
Scope options on dashboardsTip: If you experience any problems with scoping tiles, you'll find FAQs and help in the article How to scope tiles.
List List allows you to select one or more objects or groups.
You can add multiple
objects and groups . To remove anobject or group click the x to the right of its name.Tip: Start typing and after two characters you'll see suggestions that match the name appear.
Tips for using wildcards when searching for objects or groupsBy default searching will look for the top 10 items containing the words listed in the search. If you wish to create a more specific search you will need to use wildcards (*).
If you place a wildcard after the term you are looking for, it will find all the objects which start with that word searched and any terms that may follow. If you place a wildcard at the start of the search term, it will look for objects that contain the searched word and also have terms before that word.
If you enclose your searched term in wildcards it will look for objects which contain the searched word, this object will not begin or end with the term searched.
Group Group allows you to select members of a specific group. Only one group can be selected.
Advanced Advanced allows you to select a group, class or both. You must at least define either a group or class. You can define both. You can also use criteria to narrow down your selection.
Group:
Same as the group option above.
Class:
Class equates to the target class within SCOM. As you type the dropdown will be populated with suggestions of matching classes from SCOM, from which you can select the required class.
Criteria:
Criteria allows you to create an expression to further refine the scope.
Examples for commonly used criteriaObjects you would like to see Criteria Objects with particular text in their name DisplayName like '%Server1%'Objects starting with a particular string DisplayName like 'test%'All objects in maintenance mode InMaintenanceMode = 'TRUE'Only healthy objects HealthState = 1Objects with a health state in SCOM of 0, an unknown health state (uninitialized), a gray health state icon with a question mark. HealthState = 0Objects that are not healthy HealthState != 1Objects in critical state HealthState = 3Objects in critical or warning state HealthState = 2 or HealthState = 3To show all gray uninitialised objects HealthState = 0 OR HealthState IS NULLAll objects not in maintenance mode InMaintenanceMode != 'TRUE'Objects where the parent agent is offline IsAvailable='false'Objects that are offline, in maintenance or state unknown IsAvailable='false' OR InMaintenanceMode=1 OR HealthState=0Computers with a particular OS OSVersion = '6.3.9600'List objects by name and filter by HealthState (Name like '%Server3%' OR Name like '%Server4%' OR Name like '%Server2%') AND HealthState=3List objects by SCOM Id and filter by HealthState Id IN ('7021174b-9e5d-5fbf-878a-42b9f0bf6f4a', '9bd4a1cc-f07a-0e36-b37d-d9ee974e0f3c') AND HealthState=3Exclude object from the Group specified DisplayName not like '%server3%'Exclude objects from the Group specified (DisplayName NOT LIKE '%server3%') AND (DisplayName NOT LIKE '%server4%')For more information see:
Scope options on perspectivesNote: If you never used a perspective, you should read Working with perspectives before scoping tiles on perspectives.
The power of perspectives is that tiles on a perspective can use a dynamic scope. A dynamic scope considers the currently viewed
object . A dynamic scope consists of two different states:the configuration of the scope in the tile (for example, "consider child objects of type logical disk for the currently viewed object")
the actual resolved scope that depends on which
object you are currently viewing ("this object has 5 child objects of type logical disk")
After configuring the dynamic scope once in the tile, you'll get different results depending how the scope is resolved on the different
objects you are viewing.Suggestions
Suggestions are generated based on the object you are currently viewing. You'll see a list of relevant scope options based on the object's relations to other objects. Suggestions don't cover every possible scope, but they are a quick and easy way to select a suitable scope for your tile.
Note: Suggestions won't be shown if an object has no children, parents or siblings.
Tip: If the exact scope you want isn't listed in the suggestions, you can select a suggested scope that is similar to the one you want, and then click on custom. The custom section will now automatically be filled with the suggestion you picked and you can edit the scope here to adjust it exactly to your needs. This is a more intuitive way to pick a scope than starting in the custom section and navigating the SCOM object model for classes and groups.
Double-check the scope when using suggestions: Using suggestions is an easy way to pick a scope, but you need to make sure that the generated suggestion is appropriate for all objects that use the perspective.
For example, when you pick a suggestion for an EA, you will get suggestions that are specific to the map, dependencies, and availability tests for this one EA. On perspectives you want to use for all EAs, you have to change the scope suggestion in the custom section so that the tile work for all EAs.Walkthrough: Editing a scope suggestion to make it work for all EAsEnterprise Applications are designed so that you can map out the servers that make up the application. You can then configure tiles to show information related to just the servers on the EA's map. When you create a perspective that will be used for all EAs, you need to make sure that you scope the tiles so that they work for any EA. When you start with a suggestion, the tile's scope only works for the one EA you're currently looking at, and this is why you need to edit the scope:
For an EA you want to scope to the servers that are specified on the EA map by selecting something from the suggestions (Dashboard Server 4.2 and above) that shows something similar to the following:
This /<YourApplicationName> Map / ... / Windows ComputerThe above will scope the tile to all the objects of class Windows Computer on this EAs map.
The screenshot below shows some scope suggestions for an application called FinanceXS. The bold text shows the currently selected scope is This object. The cursor shows the option
This / FinanceXS / ... / Windows Computer. Once chosen this scope will show all the Windows computers shown on the applications map.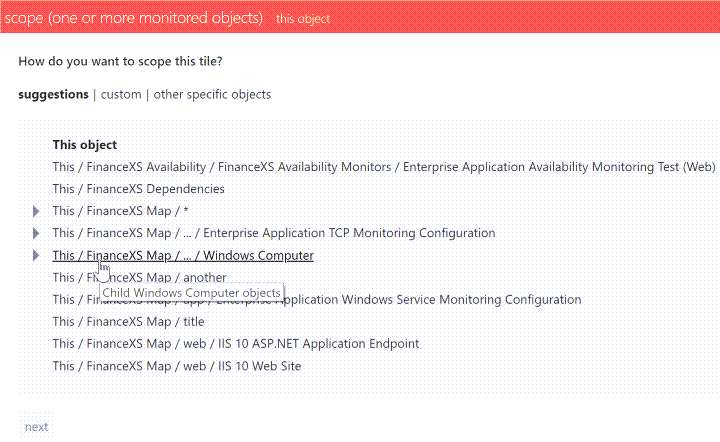
Next, we need to adjust the specified scope to allow it to work for all EAs, rather than just this one.
- In the scope section click custom.
Click on the text
<YourApplicationName> Map (children)which is your first scope step. This will expand the scope step so you can edit it.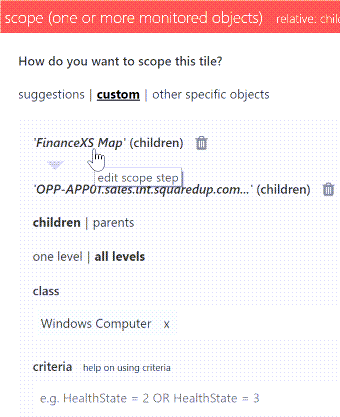
Remove the auto-populated class
<YourApplicationName> Mapby clicking the cross x next to it.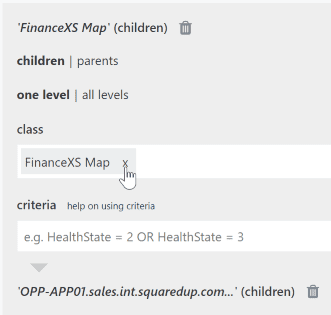
Start typing
Enterprise Application - Mapand select this from the list to add this class. This is so that this tile scope will work for all EAs, rather than just this one EA.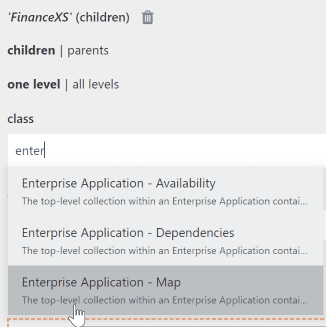
- The scope is now configured to show all the Windows computers on the EA's map, whichever EA you happen to be viewing with the perspective.
How to read the suggestionsYou can pick between "this object" and objects that are related to this object as parents, children or siblings. The suggestions for children are written as paths that follow the SCOM object tree structure, parents and siblings can be identified by the word parent or sibling in the suggestion.
A parent of an object is any object that hosts or contains that object.
A child of an object is any object that this object hosts or contains.
A sibling of an object is any object of the same class that is hosted by the same parent.This object The dynamic scope will be resolved to the object currently viewed.
"this object" option which does NOT mean the actual one object like for the target setting but the relative object I'm looking at
This / child/child/class of objectThe dynamic scope will be resolved to children of the object currently viewed.
You select objects of a particular class that are contained in path. The class of the objects you are selecting is stated at the end of the path.
This / * The dynamic scope will be resolved to children of the object currently viewed.
If a path ends with a wildcard (*) it means that you select all objects of any class within the path.
Technically it means that we fill the class field with the class "logical entity" since every object in SCOM has this class, it is a "base" class
Example:
This / IIS Web Server / *selects all objects of any class in the level belowThis / IIS Web Server.This / child/ ... /class of objectThe dynamic scope will be resolved to children of the object currently viewed.
If a path contains an ellipsis (...) it means that you select objects of a particular class that are contained in all of the objects that are contained in the path preceding the ellipsis. The class of the objects you are selecting is stated at the end of the path.
Example:
This / Sales App Map / ... / Windows Computerselects all objects of the class Windows Computer in theThis / Sales App Mappath.Parent class of objectThe dynamic scope will be resolved to parents of the object currently viewed. Sibling class of objectThe dynamic scope will be resolved to siblings of the object currently viewed. Show more triangle next to a suggestion
You can click the show more triangle to expand the list of suggestions and see more specific paths.Example for navigating suggestions in an EAIf you are looking at an EA, the path to find all windows computers in that EA may read
Map / ... / Windows Computer. It returns all objects of the Windows Computer class contained within all of the paths underMap.To narrow the scope down, you can click on the triangle to expand the suggestion and select one of the more specific paths. If you select
Map / Web / Windows Computeryou will find all objects of the Windows Computer class in the pathMap / Web.If you choose the option
Map / *you'll find all objects contained in the map. If you extend this suggestion by clicking on the triangle, you'll see suggestions to select all objects in a more specific path, for exampleMap / Web / *.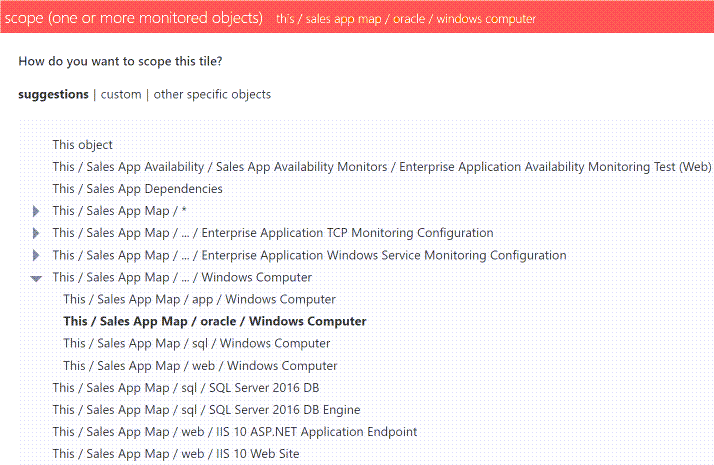
Custom
Here you can pick objects that are related to the object you are currently looking at. If you want to create a specific scope that is not listed under suggestions, you can create the scope here.
Tip: You can pick a similar scope under suggestions first and then click on custom to edit it.
How to pick a simple relation (one step through the SCOM model)At the top, you'll see the name of the object you are currently looking at. Now you can choose if you want to pick parents or children of that object, and if this parent or child relation should be considered only one level up or down the SCOM model or through all levels.
Class:
Here you pick the class of the objects you want to select. If you leave this field empty, the scope falls back to the "this object" scope.
Note: You will only see groups and classes that the object you are currently looking at is a member of.
Tip: If you want to pick objects of any class, enter the SCOM base class logical entity in the class field.
Tip: If you want to find out what classes the object you are interested in belongs to, you can go to the Monitored Entity perspective of that object. You'll see all the classes the object belongs to listed there.
Criteria:
You can narrow the selection of objects of a particular class down further by entering criteria for those objects. For more help see How to use criteria when scoping objects.
Tip: If you want to find out what properties you can base your criteria on, you can go to the Monitored Entity perspective of the object you are interested in. You'll see all the properties for criteria listed there.
.
Example for picking a simple relationFor example, for a perspective created for the group IIS8 Computer Group adding a Status tile scoped to show children with a class of
objectwill show the group members, i.e. the members of the IIS8 Computer Group.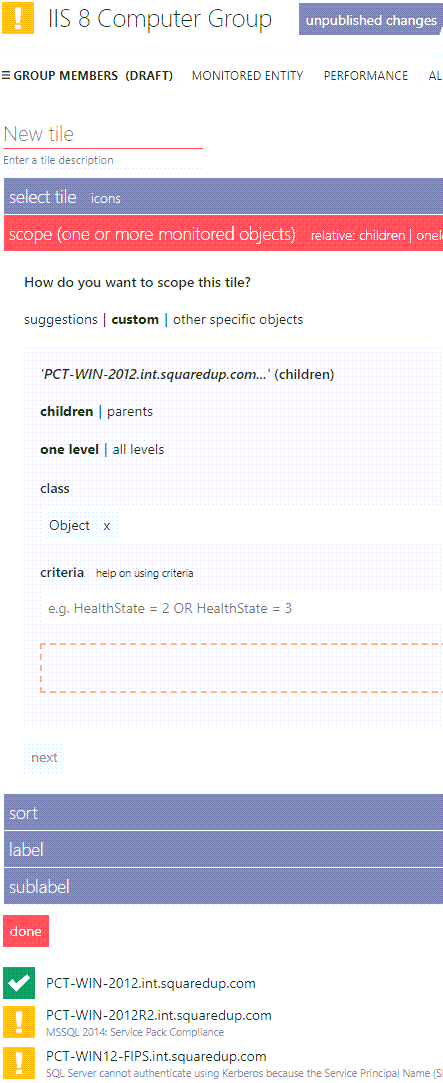 How to pick advanced relations (multiple steps through the SCOM model)
If you need to traverse a more advanced SCOM object model like an EA, you can use the + button to add more steps. This creates a scope that can go through any kind of path of the SCOM object model.
Complete the following steps and then click the + button after you're done to add the next level of SCOM objects:
At the top, you'll see the name of the object you are currently looking at. Now you can choose if you want to pick parents or children of that object, and if this parent or child relation should be considered only one level up or down the SCOM model or through all levels.
Class:
Here you pick the class of the objects you want to select. If you leave this field empty, the scope falls back to the "this object" scope.
Note: You will only see groups and classes that the object you are currently looking at is a member of.
Tip: If you want to pick objects of any class, enter the SCOM base class logical entity in the class field.
Tip: If you want to find out what classes the object you are interested in belongs to, you can go to the Monitored Entity perspective of that object. You'll see all the classes the object belongs to listed there.
Criteria:
You can narrow the selection of objects of a particular class down further by entering criteria for those objects. For more help see How to use criteria when scoping objects.
Tip: If you want to find out what properties you can base your criteria on, you can go to the Monitored Entity perspective of the object you are interested in. You'll see all the properties for criteria listed there.
.
Other specific objects
Gives you the normal, non-dynamic scope options you are used to when scoping tiles on dashboards. This means the tile will not dynamically adapt it's content to the currently viewed
object , it will always show data for the staticobject picked here.Since the power of perspectives is that their tiles can show data for different
objects depending on whatobject is currently being viewed, you should only select this option when you are sure that there is no relationship between the desired scope and the currently viewedobject .Notes for selecting the scope for Status Icons or Blocks Which status is displayed depends on what you choose as a scope:
If you want to see the status of individual objects (for example, two individual servers), select multiple objects in the list section.
If you want to see the status of a group itself rather than the individual objects within the group, select a group in the list section.
If you want to see the status of each individual group member of a group, select a group in the group section.
If you want to see the health state of all groups, select the class "group" in the advanced section.
Provider:
Select your Splunk provider from the select provider drop-down and click next.
You can only use providers of the same type as the tile. Providers of other types won't be shown in the select provider drop-down.
Search:
Enter your Splunk search query using the Search Processing Language (SPL).
Queries for ScalarsSince you want to display a single value, make sure that your search query returns a single row with a single value. If your query returns multiple columns, Dashboard Server will pick one of them. If your query return multiple rows, Dashboard Server counts the number of rows and displays the result as the value.
Tip for better performance: If you want to display the number of rows, use your Splunk search query to count the rows instead of letting Dashboard Server count them.
Queries for GridsThere are no special requirements for Splunk search queries for grids.
Tip:
For some search queries, Splunk adds additional columns (system fields) to your search results, which you usually don't need. You can hide them by putting
| fields - _*in your search query. This way, you don't have to hide them all manually in the grid column settings.Example:
You need to replace
my_indexwith the name of your index.Copysearch index=my_index | fields - _*Queries for Line GraphsThe return data must include a column called
_time. Most common Splunk commands for time series data (likebin,timechart,xyseries, etc.) produce a_timecolumn.Example:
You need to replace
my_indexwith the name of your index.Copysearch index=my_index | timechart span=1h count by hostQueries for SparklinesThe return data must include a column called
_time. Most common Splunk commands for time series data (likebin,timechart,xyseries, etc.) produce a_timecolumn.Example:
You need to replace
my_indexwith the name of your index.Copysearch index=my_index | timechart span=1h count by hostQueries for Bar GraphsThere are no special requirements for Splunk search queries for Bar Graphs.
Queries for DonutsThere are no special requirements for Splunk search queries for Donuts.
Queries for Status Icons and BlocksThe return data must include a
statecolumn which must contain the following values:healthy,critical, and/orwarning(the values are not case-sensitive). Any other values will result in stateunknown.The state values define the color of the status icons or blocks:
Healthygreen Warningyellow Criticalred Unknowngray Filtering behavior of Splunk
Splunk will only return results that match your search query. If data doesn't fit your search, Splunk throws those results away. This means a search like
eval state=case(count > 1000, "critical")will only return results with a case count bigger than 1000. Any results with less than 1000 cases will be discarded and you'll only see "critical" blocks or icons in the tile.Example:
You need to replace
my_indexwith the name of your index.Copysearch index=my_index | stats count by host | eval state=if(count> 1000,"critical","healthy") templates button:
Allows you to import searches that are saved in your Splunk instance.
Which templates are available in a Splunk tile depends on the permissions of the Splunk user account that is used in the configuration of the Splunk provider. Any search queries that this user can access in Splunk (for example, queries in saved searches, Splunk reports, dashboards, etc.) are visible as templates in Splunk tiles. For example, if you used Splunk User A for the configuration of Splunk provider A, a Splunk tile that uses Splunk provider A will show all templates that are visible to Splunk User A in Splunk.
 mustache picker:
You can use the mustache picker to use the page timeframe in your search queries.
If you defined a scope, you can use the mustache picker to insert values that refer only to the defined scope.
What is the page timeframe?The page timeframe is the timeframe setting a dashboard
or perspective is currently using. When a user changes the page timeframe, all tiles that use the page timeframe will adapt to the new timeframe. Tiles that don't use the dynamic page timeframe aren't affected and won't change. Using the page timeframe in the search query
Possible scenario:
You want to avoid that it is possible to use a page timeframe shorter than the time span in the search query, because in that case the graph would show no results.Example:
This search uses a fixed time span of 1 day:Copysearch index=opp_events | timechart span=1d count by hostTimeframe setting: use page timeframe
When you set the page timeframe for the dashboard to "12 hours", the graph will be empty since there are no 24 hour results in the last 12 hours.
Solution:
Instead of using a fixed time span, use the page timeframe in your search query. You can use the mustache picker to insert page timeframe values.Example:
This search uses a dynamic span with page timeframe:CopySearch query: search index=opp_events | timechart span={{timeframe.isoDuration.startsWith("PT") ? '1h' : '1d'}} count by hostTimeframe setting: use page timeframe
The search now considers the currently set page timeframe. If the page timeframe is set to hours (like "last 12 hours"), it will search for results within a 1 hour span. If the page timeframe is set to anything else (like "last 6 months"), it will search for results within a 1 day span.
Using the scope in the search queryValues that refer to the defined scope carry the prefix
scope.before the value. For example, you can use the value{{scope[0].displayName}}for the name of the first item in your scope. You can manipulate the values with javascript syntax. For example, if you want to insert a quoted comma separated list of displayNames from every item in the scope, you can use{{scope.map(item => '"'+item.displayName+'"').join(',')}}.Timeframe:
Here you set the timeframe for your search:
specific timeframe:
A fixed timeframe for the search. You can use the
 timeframe button to get some examples for different timeframes. If you want to create your own timeframe, use the Splunk syntax for timeframes.
If you used a template, Dashboard Server inherits the timeframe you set for the search in Splunk and puts it in the timeframe field as a specific timeframe.
You can use the mustache picker to use page timeframe values in the specific timeframe field.
What is the page timeframe?The page timeframe is the timeframe setting a dashboard
or perspective is currently using. When a user changes the page timeframe, all tiles that use the page timeframe will adapt to the new timeframe. Tiles that don't use the dynamic page timeframe aren't affected and won't change.Using the page timeframe in the specific timeframe fieldPossible scenario:
You want to put a cap on the page timeframe that can be used, because if a search returns a lot of data, a long page timeframe like "last 6 months" would lead to long loading times.Solution:
Instead of setting the timeframe to use page timeframe, choose specific timeframe and create a limit for the page timeframe there. You can use the mustache picker to insert page timeframe values.Example:
timeframe setting: specific timeframeCopy{{timeframe.unixStart < Date.now()-(86400*7*1000) ? '-7d' : timeframe.isoStart}}This specific timeframe limits the page timeframe to 7 days. If the current page timeframe is set to "last 7 days" or anything shorter than that, the search uses the page timeframe. If the current page timeframe is longer (like "last 6 months"), the search will disregard the page timeframe setting and use "last 7 days" instead.
If you defined a scope, you can use the mustache picker to create a specific timeframe that considers the scope
Using the scope in the specific timeframe fieldIf you defined a scope, you can use the mustache picker to insert values that refer only to the defined scope.
Using the scope with fixed values
You can use fixed values for creating a specific timeframe that considers the scope.Example:
You want to create a timeframe that considers how many items are in the scope. If there are less than 100 items, you want the timeframe to be 12 hours, if there are more than 100 items, you want the timeframe to be 1 day.timeframe setting: specific timeframe
Copy{{scope.length > 100 ? '-12h' : '-1d'}}Using the scope with the page timeframe
You can use the dynamic page timeframe for creating a specific timeframe that considers the scope.Example:
You want to create a timeframe that puts a cap on the page timeframe that can be used depending on the size of the scope. If the scope has more 100 items in it, you want the longest possible page timeframe setting to be 1 day (this means if the page timeframe is set to "last 12 hours", the page timeframe will be used, but if it is set to "last 6 months", this will be ignored and 1 day will be used). If the scope has less than 100 items in it, you want the timeframe to adjust to any page timeframe.timeframe setting: specific timeframe
Copy{{ timeframe.unixStart < Date.now()-(86400*1000) && scope.length > 100 ? '-1d' : timeframe.isoStart }}use page timeframe:
A dynamic timeframe that depends on the current page timeframe.Tips for using the page timeframeThe page timeframe is the timeframe setting a dashboard
or perspective is currently using. When a user changes the page timeframe, all tiles that use the page timeframe will adapt to the new timeframe. Tiles that don't use the dynamic page timeframe aren't affected and won't change.Using page timeframe means your search query will adapt to the dynamic page timeframe.
While being able to change the timeframe dynamically brings a lot of flexibility for showing data over different timeframes in the same tile, it can also mean that some page timeframe settings are not ideal for your intended search:
The tile shows no data because the current page timeframe is too short for the fixed time span in your search query. In this case, you can use the page timeframe instead of fixed values in the search query
Using the page timeframe in the search queryPossible scenario:
You want to avoid that it is possible to use a page timeframe shorter than the time span in the search query, because in that case the graph would show no results.Example:
This search uses a fixed time span of 1 day:Copysearch index=opp_events | timechart span=1d count by hostTimeframe setting: use page timeframe
When you set the page timeframe for the dashboard to "12 hours", the graph will be empty since there are no 24 hour results in the last 12 hours.
Solution:
Instead of using a fixed time span, use the page timeframe in your search query. You can use the mustache picker to insert page timeframe values.Example:
This search uses a dynamic span with page timeframe:CopySearch query: search index=opp_events | timechart span={{timeframe.isoDuration.startsWith("PT") ? '1h' : '1d'}} count by hostTimeframe setting: use page timeframe
The search now considers the currently set page timeframe. If the page timeframe is set to hours (like "last 12 hours"), it will search for results within a 1 hour span. If the page timeframe is set to anything else (like "last 6 months"), it will search for results within a 1 day span.
The loading time for the tile is very long because the current page timeframe is too long for the search query. In this case, you can use the page timeframe in the specific timeframe setting to put a cap on the page timeframe that can be used.
Using the page timeframe in the specific timeframe fieldPossible scenario:
You want to put a cap on the page timeframe that can be used, because if a search returns a lot of data, a long page timeframe like "last 6 months" would lead to long loading times.Solution:
Instead of setting the timeframe to use page timeframe, choose specific timeframe and create a limit for the page timeframe there. You can use the mustache picker to insert page timeframe values.Example:
timeframe setting: specific timeframeCopy{{timeframe.unixStart < Date.now()-(86400*7*1000) ? '-7d' : timeframe.isoStart}}This specific timeframe limits the page timeframe to 7 days. If the current page timeframe is set to "last 7 days" or anything shorter than that, the search uses the page timeframe. If the current page timeframe is longer (like "last 6 months"), the search will disregard the page timeframe setting and use "last 7 days" instead.
Configure the settings for the visualization you chose:
Settings for ScalarsScalar
Font size Allows you to set the font size of the value in the tile.
Unit Allows you to add a unit to the value displayed in the Scalar tile. For example, if your value shows a time in milliseconds, you can enter "ms" or if your value shows pageviews, you can enter "pageviews".
Value formatter Allows you to format the value by using the mustache picker. For example, you can round the value up or down or convert it.
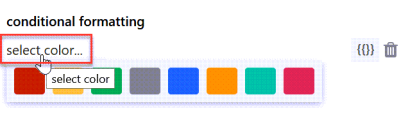
Conditional formatting:
You can display the scalar in different colors based on conditions you defined here. For example, you can display the scalar in green when the value is below 100 and in red when it is above 100.
Click on add to configure a condition.
Click on select color.... to open the color picker. Select the color for this condition.
Enter your condition in the field next to the color. You can use the
valueproperty and manipulate it with JavaScript String and Regex APIs. When you click on the mustache picker, you'll get some examples:Value is greater than something, less than something, etc.
For example:
{{value < 10}}(The color you picked will be used if the value is less than 10)Value is present in the result
For example:
value.IndexOf('error') != -1(The color you picked will be used if the string value "error" is present in the results)Value matches one of the regular expressions you defined
For example:
value.match(/healthy|good|up/)(The color you picked will be used if the string values arehealthy,good, orup)
Display:
Here you decide how the color is used:
Tile background Highlight the tile in the color you defined. Text foreground
Display the text in the color you defined. Link options
Allows you to turn the graph item(s) into links. You can either enter plain text to create a fixed link (URL always stays the same) or use dynamic properties to create a dynamic link.
Dynamic links make use of dynamic properties which are inserted as part of the URL. This creates a template URL that will be resolved to an actual URL based on the items properties.
For example, if you want to link to tickets in your ticket system and the format of the URL for tickets in your system is
https://www.my-system/ticket-123, where123is the ticket ID, you can use the dynamic property that contains the ticket ID and enter the dynamic URLhttps://www.my-system/ticket-{{ticketID}}.For scalars, you can only use the dynamic property
valuein dynamic links, which means the link changes when the value of the scalar changes. Since a scalar is just one item, it would also make sense to use a fixed link, for example the link to the website of which you are displaying the response time.For status icon or bars and the rows of a grid, you usually want to use a dynamic link since you get multiple items or rows that represent different things. You can use any of the dynamic properties the mustache picker offers you.
Examples for URLs with dynamic properties for popular APIsDynamic mustache properties and values you need to change according to your instance are highlighted in bold.
ServiceNow incidents:
https://<your-instance>.service-now.com/nav_to.do?uri=%2Fincident.do%3Fsys_id%3D{{sys_id}}PagerDuty incidents:
{{incident.html_url}}Azure DevOps projects:
https://dev.azure.com/<your-instance>/{{name}}Azure DevOps builds:
https://dev.azure.com/<your-instance>/_build/results?buildId={{id}}Zendesk tickets:
https://<your-instance>.zendesk.com/agent/tickets/{{id}}Azure Application Insights
https://portal.azure.com/#@squaredup.net/resource/{{ResourceId}}Settings for GridsGrid columns
Grid columns opens the grid designer, where you can show or hide columns, change the order of columns, edit column names or add custom columns.
Important note if you are using properties with hyphens for grid columnsProperty names that contain hyphens (for example
properties.name-with-hyphens) can't be processed due to a JavaScript limitation. If you want to use a property that contains a hyphen, you have two options:If you have access to the data source and can change the name of the property, change the name of the property to a name without hyphens.
For example, if your Elasticsearch query uses a property (an aggregation, a grouping or any other property you want to use) with a name that contains a hyphen, you can either access your Elasticsearch instance and change the name there or you can overwrite the name in the query dsl field.
If you can't change the name of the property, you need to enter the property name in the following format:
Original property name:
{{properties.name-with-hyphens.value}}New format:
{{properties['name-with-hyphens'].value}}
Grid options
Row link Allows you to turn the graph item(s) into links. You can either enter plain text to create a fixed link (URL always stays the same) or use dynamic properties to create a dynamic link.
Dynamic links make use of dynamic properties which are inserted as part of the URL. This creates a template URL that will be resolved to an actual URL based on the items properties.
For example, if you want to link to tickets in your ticket system and the format of the URL for tickets in your system is
https://www.my-system/ticket-123, where123is the ticket ID, you can use the dynamic property that contains the ticket ID and enter the dynamic URLhttps://www.my-system/ticket-{{ticketID}}.For scalars, you can only use the dynamic property
valuein dynamic links, which means the link changes when the value of the scalar changes. Since a scalar is just one item, it would also make sense to use a fixed link, for example the link to the website of which you are displaying the response time.For status icon or bars and the rows of a grid, you usually want to use a dynamic link since you get multiple items or rows that represent different things. You can use any of the dynamic properties the mustache picker offers you.
Examples for URLs with dynamic properties for popular APIsDynamic mustache properties and values you need to change according to your instance are highlighted in bold.
ServiceNow incidents:
https://<your-instance>.service-now.com/nav_to.do?uri=%2Fincident.do%3Fsys_id%3D{{sys_id}}PagerDuty incidents:
{{incident.html_url}}Azure DevOps projects:
https://dev.azure.com/<your-instance>/{{name}}Azure DevOps builds:
https://dev.azure.com/<your-instance>/_build/results?buildId={{id}}Zendesk tickets:
https://<your-instance>.zendesk.com/agent/tickets/{{id}}Azure Application Insights
https://portal.azure.com/#@squaredup.net/resource/{{ResourceId}}Important note if you are using properties with hyphens for row linksProperty names that contain hyphens (for example
properties.name-with-hyphens) can't be processed due to a JavaScript limitation. If you want to use a property that contains a hyphen, you have two options:If you have access to the data source and can change the name of the property, change the name of the property to a name without hyphens.
For example, if your Elasticsearch query uses a property (an aggregation, a grouping or any other property you want to use) with a name that contains a hyphen, you can either access your Elasticsearch instance and change the name there or you can overwrite the name in the query dsl field.
If you can't change the name of the property, you need to enter the property name in the following format:
Original property name:
{{properties.name-with-hyphens.value}}New format:
{{properties['name-with-hyphens'].value}}
Show column headers You can choose between showing or hiding the header for all columns.
Expand rows automatically Activate this checkbox if you want the row height to expand automatically based on the row content, for example if your grid uses increased text size, images, emojis etc.
Limit number of results displayed You can set a limit of the initial number of results displayed in the grid. If you have set a limit and there are more results to display, users will see a "show all" button below the grid.
Font size Use the slider to adjust the font size.
Tip for column sizing: You can change the column width directly in the grid by clicking on the divider lines between columns and dragging them to the width you want. You need to show column headers (by activating the show column headers check box) to be able to change the column width.
Resizing columns while in edit mode affects how the grid looks by default when users open the dashboard. Users can temporarily change the column sizes by dragging them, but those changes only last until they leave the page.Settings for Line GraphsData range
The Data Range option allows you to choose the range of data the graph will display. For line graphs, this means the data on the y-axis.
percentage Shows 0 to 100 fit to data Shows the data minimum to data maximum fit to data (from zero) Shows from 0 to the data maximum custom Allows you to specify the min and max custom fit Allows you to specify the min and max limits, so that data outside your settings will not be shown. If all the data falls within your specified ranges then the y-axis range will fit to the data rather than your caps.
Display
Height: Allows you to set the height of the tile with a slider.
Label
Allows you to change the label of the results.
Show legend:
Allows you to show or hide the legend of the graph.
Label:
auto Choose this option if you want to use the default label that has been created automatically.
custom
Here you can change the label to a custom label. You can use static text and dynamic properties. Use the mustache picker
 to select dynamic properties from the response data to use them as labels.
For more information see How to use Custom Labels
Important note if you are using external API properties with hyphens for custom labels (Web API tile, Elasticsearch tile, Splunk tile)Property names that contain hyphens (for example
properties.name-with-hyphens) can't be processed due to a JavaScript limitation. If you want to use a property that contains a hyphen, you have two options:If you have access to the data source and can change the name of the property, change the name of the property to a name without hyphens.
For example, if your Elasticsearch query uses a property (an aggregation, a grouping or any other property you want to use) with a name that contains a hyphen, you can either access your Elasticsearch instance and change the name there or you can overwrite the name in the query dsl field.
If you can't change the name of the property, you need to enter the property name in the following format:
Original property name:
{{properties.name-with-hyphens.value}}New format:
{{properties['name-with-hyphens'].value}}
Settings for SparklinesData Range
The Data Range option allows you to choose the range of data the graph will display. For line graphs, this means the data on the y-axis.
percentage Shows 0 to 100 fit to data Shows the data minimum to data maximum fit to data (from zero) Shows from 0 to the data maximum custom Allows you to specify the min and max custom fit Allows you to specify the min and max limits, so that data outside your settings will not be shown. If all the data falls within your specified ranges then the y-axis range will fit to the data rather than your caps.
Sort
Sort allows you to change the order of the results displayed. You can sort by value (ascending or descending) or label (alphabetically ascending or descending).
Label
Allows you to change the label of the results.
auto Choose this option if you want to use the default label that has been created automatically.
custom
Here you can change the label to a custom label. You can use static text and dynamic properties. Use the mustache picker
to select dynamic properties from the response data to use them as labels.For more information see How to use Custom Labels
Important note if you are using external API properties with hyphens for custom labels (Web API tile, Elasticsearch tile, Splunk tile)Property names that contain hyphens (for example
properties.name-with-hyphens) can't be processed due to a JavaScript limitation. If you want to use a property that contains a hyphen, you have two options:If you have access to the data source and can change the name of the property, change the name of the property to a name without hyphens.
For example, if your Elasticsearch query uses a property (an aggregation, a grouping or any other property you want to use) with a name that contains a hyphen, you can either access your Elasticsearch instance and change the name there or you can overwrite the name in the query dsl field.
If you can't change the name of the property, you need to enter the property name in the following format:
Original property name:
{{properties.name-with-hyphens.value}}New format:
{{properties['name-with-hyphens'].value}}
Settings for Bar GraphsData Range
The Data Range option allows you to choose the range of data the graph will display. For line graphs, this means the data on the y-axis.
percentage Shows 0 to 100 fit to data Shows the data minimum to data maximum fit to data (from zero) Shows from 0 to the data maximum custom Allows you to specify the min and max custom fit Allows you to specify the min and max limits, so that data outside your settings will not be shown. If all the data falls within your specified ranges then the y-axis range will fit to the data rather than your caps.
Sort
Sort allows you to change the order of the results displayed. You can sort by value (ascending or descending) or label (alphabetically ascending or descending).
Label
Allows you to change the label of the results.
auto Choose this option if you want to use the default label that has been created automatically.
custom
Here you can change the label to a custom label. You can use static text and dynamic properties. Use the mustache picker
to select dynamic properties from the response data to use them as labels.For more information see How to use Custom Labels
Important note if you are using external API properties with hyphens for custom labels (Web API tile, Elasticsearch tile, Splunk tile)Property names that contain hyphens (for example
properties.name-with-hyphens) can't be processed due to a JavaScript limitation. If you want to use a property that contains a hyphen, you have two options:If you have access to the data source and can change the name of the property, change the name of the property to a name without hyphens.
For example, if your Elasticsearch query uses a property (an aggregation, a grouping or any other property you want to use) with a name that contains a hyphen, you can either access your Elasticsearch instance and change the name there or you can overwrite the name in the query dsl field.
If you can't change the name of the property, you need to enter the property name in the following format:
Original property name:
{{properties.name-with-hyphens.value}}New format:
{{properties['name-with-hyphens'].value}}
Color
Here you can enable or disable graph color matching.
Settings for DonutsSort
Sort allows you to change the order of the results displayed. You can sort by value (ascending or descending) or label (alphabetically ascending or descending).
Display
Size mode:
Default Displays the donut scaled to the height of the tile. Fill Enlarges the donut to use the whole width of the tile. If you chose the fill option and show the legend, you can define the size of the legend with a slider. Show legend:
Allows you to show or hide the legend of the graph.
Display mode:
Allows you to switch between displaying absolute values or percentages.
Color palette:
Here you can choose between different color palettes.
Note: If there are more items than colors, the colors repeat from the beginning.
Tip for displaying priorities or health states: If you want to display priorities or health states from a data source that doesn't enrich the data with information about priority or health (like the SQL tile or external APIs), use the custom color option and map the results to the correct color. This way, you can make sure that healthy or low priority results are displayed in green, unhealthy or high priority results are displayed in red, etc. If you use the color palettes Priorities, Health1, or Health2 the colors get assigned depending on how the results are sorted, which doesn't guarantee that the colors make sense for the priority or state they represent.
General 10 different colors without specific meaning Priorities 5 different colors representing 5 different priority states Health1 3 different colors representing 3 different health states
(red=unhealthy, green=healthy, gray=unknown)Health2 4 different colors representing 4 different health states
(red=critical, orange=unhealthy, green=healthy, gray=unknown)Pastel 10 different pastel colors without specific meaning Blue 4 different shades of blue from dark to light Orange 4 different shades of orange from dark to light Green 4 different shades of green from dark to light Pink 4 different shades of pink from dark to light Custom Here you can choose colors and map them to a value.
Click on Select color... to select a color and enter the name of the value that you want to display in that color. Make sure you spell the value's name correctly (case-sensitive), otherwise the color won't be assigned to it.
Note if your color mapping doesn't work (color stays gray)If you entered the value's name correctly (case-sensitive) and your mapping still doesn't work, check if the mapping value contains leading or trailing spaces. Try to enter the value with and without those spaces. Alternatively, you can remove spaces from the mustache expression and enter the values without spaces.
Example:
Mustache expression with leading and trailing spaces in the values:
{{#if Status == "1" }} Healthy {{elseif Status == "2" }} Down {{elseif Status == "3" }} Warning {{/if}}Mustache expression without spaces in the values:
{{#if Status == "1" }}Healthy{{elseif Status == "2" }}Down{{elseif Status == "3" }}Warning{{/if}}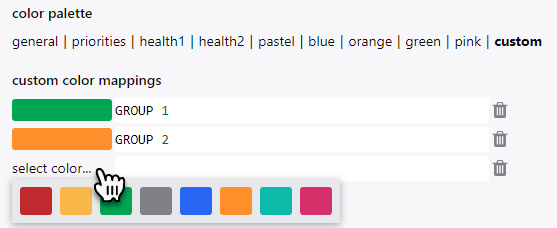 Settings for Status Icons
Filtering behavior of Splunk
Splunk will only return results that match your search query. If data doesn't fit your search, Splunk throws those results away. This means a search like
eval state=case(count > 1000, "critical")will only return results with a case count bigger than 1000. Any results with less than 1000 cases will be discarded and you'll only see "critical" blocks or icons in the tile.Link options
item link:
Allows you to turn the graph item(s) into links. You can either enter plain text to create a fixed link (URL always stays the same) or use dynamic properties to create a dynamic link.
Dynamic links make use of dynamic properties which are inserted as part of the URL. This creates a template URL that will be resolved to an actual URL based on the items properties.
For example, if you want to link to tickets in your ticket system and the format of the URL for tickets in your system is
https://www.my-system/ticket-123, where123is the ticket ID, you can use the dynamic property that contains the ticket ID and enter the dynamic URLhttps://www.my-system/ticket-{{ticketID}}.For scalars, you can only use the dynamic property
valuein dynamic links, which means the link changes when the value of the scalar changes. Since a scalar is just one item, it would also make sense to use a fixed link, for example the link to the website of which you are displaying the response time.For status icon or bars and the rows of a grid, you usually want to use a dynamic link since you get multiple items or rows that represent different things. You can use any of the dynamic properties the mustache picker offers you.
Examples for URLs with dynamic properties for popular APIsDynamic mustache properties and values you need to change according to your instance are highlighted in bold.
ServiceNow incidents:
https://<your-instance>.service-now.com/nav_to.do?uri=%2Fincident.do%3Fsys_id%3D{{sys_id}}PagerDuty incidents:
{{incident.html_url}}Azure DevOps projects:
https://dev.azure.com/<your-instance>/{{name}}Azure DevOps builds:
https://dev.azure.com/<your-instance>/_build/results?buildId={{id}}Zendesk tickets:
https://<your-instance>.zendesk.com/agent/tickets/{{id}}Azure Application Insights
https://portal.azure.com/#@squaredup.net/resource/{{ResourceId}}Important note if you are using properties with hyphens in the link optionsProperty names that contain hyphens (for example
properties.name-with-hyphens) can't be processed due to a JavaScript limitation. If you want to use a property that contains a hyphen, you have two options:If you have access to the data source and can change the name of the property, change the name of the property to a name without hyphens.
For example, if your Elasticsearch query uses a property (an aggregation, a grouping or any other property you want to use) with a name that contains a hyphen, you can either access your Elasticsearch instance and change the name there or you can overwrite the name in the query dsl field.
If you can't change the name of the property, you need to enter the property name in the following format:
Original property name:
{{properties.name-with-hyphens.value}}New format:
{{properties['name-with-hyphens'].value}}
Label
Allows you to change the label of the results.
name Choose this option if you want to use the default label that has been created automatically.
custom Here you can change the label to a custom label. You can use static text and dynamic properties. Use the mustache picker
to select dynamic properties from the response data to use them as labels.For more information see How to use Custom Labels
Important note if you are using external API properties with hyphens for custom labels (Web API tile, Elasticsearch tile, Splunk tile)Property names that contain hyphens (for example
properties.name-with-hyphens) can't be processed due to a JavaScript limitation. If you want to use a property that contains a hyphen, you have two options:If you have access to the data source and can change the name of the property, change the name of the property to a name without hyphens.
For example, if your Elasticsearch query uses a property (an aggregation, a grouping or any other property you want to use) with a name that contains a hyphen, you can either access your Elasticsearch instance and change the name there or you can overwrite the name in the query dsl field.
If you can't change the name of the property, you need to enter the property name in the following format:
Original property name:
{{properties.name-with-hyphens.value}}New format:
{{properties['name-with-hyphens'].value}}
Sublabel
Allows you to add a sublabel of the results.
custom Here you can change the label to a custom label. You can use static text and dynamic properties. Use the mustache picker
to select dynamic properties from the response data to use them as labels.For more information see How to use Custom Labels
Important note if you are using external API properties with hyphens for custom labels (Web API tile, Elasticsearch tile, Splunk tile)Property names that contain hyphens (for example
properties.name-with-hyphens) can't be processed due to a JavaScript limitation. If you want to use a property that contains a hyphen, you have two options:If you have access to the data source and can change the name of the property, change the name of the property to a name without hyphens.
For example, if your Elasticsearch query uses a property (an aggregation, a grouping or any other property you want to use) with a name that contains a hyphen, you can either access your Elasticsearch instance and change the name there or you can overwrite the name in the query dsl field.
If you can't change the name of the property, you need to enter the property name in the following format:
Original property name:
{{properties.name-with-hyphens.value}}New format:
{{properties['name-with-hyphens'].value}}
none By default, no sublabels are shown. Sort
Sort allows you to change the order of the results displayed. You can also group them by their characteristics.
default By default, the sorting of the blocks or icons depends on the data source. This can be alphabetical sorting or the order in which data comes back from an API request.
sort by
Sort by label or health state, ascending or descending
group by Group by label or health state, ascending or descending
Image
Here you can choose one of the provided images or upload your own.
Tip: If you want a different selection of maps, you can download more at https://freevectormaps.com/Supported image formats: png, jpg, jpeg, gif, tif, tiff. svg, bmp
Tip: SVG images resize best since they are vector images.File size limit: 10MB
Image size: Images fill the size of the tile, which means you can resize the image by adjusting the tile's size. The size of the tile also depends on the screen the dashboard is being viewed on.
Icons
Here you can customize the icons on the image:
You can change the size of the icons with the slider
You can change the shape of the icons (square or circle)
You can drag the icons on the image into position
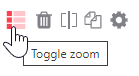
Display styles for Status icons
This setting is not done in a panel, you can change the display style even after you finished configuring the tile.
You can use toggle zoom button at the top right of the tile to change between the different ways Status icons can be displayed.
One long list 

Column list 
Icons only 
 Settings for Status Blocks
Filtering behavior of Splunk
Splunk will only return results that match your search query. If data doesn't fit your search, Splunk throws those results away. This means a search like
eval state=case(count > 1000, "critical")will only return results with a case count bigger than 1000. Any results with less than 1000 cases will be discarded and you'll only see "critical" blocks or icons in the tile.Link options
item link:
Allows you to turn the graph item(s) into links. You can either enter plain text to create a fixed link (URL always stays the same) or use dynamic properties to create a dynamic link.
Dynamic links make use of dynamic properties which are inserted as part of the URL. This creates a template URL that will be resolved to an actual URL based on the items properties.
For example, if you want to link to tickets in your ticket system and the format of the URL for tickets in your system is
https://www.my-system/ticket-123, where123is the ticket ID, you can use the dynamic property that contains the ticket ID and enter the dynamic URLhttps://www.my-system/ticket-{{ticketID}}.For scalars, you can only use the dynamic property
valuein dynamic links, which means the link changes when the value of the scalar changes. Since a scalar is just one item, it would also make sense to use a fixed link, for example the link to the website of which you are displaying the response time.For status icon or bars and the rows of a grid, you usually want to use a dynamic link since you get multiple items or rows that represent different things. You can use any of the dynamic properties the mustache picker offers you.
Examples for URLs with dynamic properties for popular APIsDynamic mustache properties and values you need to change according to your instance are highlighted in bold.
ServiceNow incidents:
https://<your-instance>.service-now.com/nav_to.do?uri=%2Fincident.do%3Fsys_id%3D{{sys_id}}PagerDuty incidents:
{{incident.html_url}}Azure DevOps projects:
https://dev.azure.com/<your-instance>/{{name}}Azure DevOps builds:
https://dev.azure.com/<your-instance>/_build/results?buildId={{id}}Zendesk tickets:
https://<your-instance>.zendesk.com/agent/tickets/{{id}}Azure Application Insights
https://portal.azure.com/#@squaredup.net/resource/{{ResourceId}}Important note if you are using properties with hyphens in the link optionsProperty names that contain hyphens (for example
properties.name-with-hyphens) can't be processed due to a JavaScript limitation. If you want to use a property that contains a hyphen, you have two options:If you have access to the data source and can change the name of the property, change the name of the property to a name without hyphens.
For example, if your Elasticsearch query uses a property (an aggregation, a grouping or any other property you want to use) with a name that contains a hyphen, you can either access your Elasticsearch instance and change the name there or you can overwrite the name in the query dsl field.
If you can't change the name of the property, you need to enter the property name in the following format:
Original property name:
{{properties.name-with-hyphens.value}}New format:
{{properties['name-with-hyphens'].value}}
Label
Allows you to change the label of the results.
name Choose this option if you want to use the default label that has been created automatically.
custom Here you can change the label to a custom label. You can use static text and dynamic properties. Use the mustache picker
to select dynamic properties from the response data to use them as labels.For more information see How to use Custom Labels
Important note if you are using external API properties with hyphens for custom labels (Web API tile, Elasticsearch tile, Splunk tile)Property names that contain hyphens (for example
properties.name-with-hyphens) can't be processed due to a JavaScript limitation. If you want to use a property that contains a hyphen, you have two options:If you have access to the data source and can change the name of the property, change the name of the property to a name without hyphens.
For example, if your Elasticsearch query uses a property (an aggregation, a grouping or any other property you want to use) with a name that contains a hyphen, you can either access your Elasticsearch instance and change the name there or you can overwrite the name in the query dsl field.
If you can't change the name of the property, you need to enter the property name in the following format:
Original property name:
{{properties.name-with-hyphens.value}}New format:
{{properties['name-with-hyphens'].value}}
Sublabel
Allows you to add a sublabel of the results.
custom Here you can change the label to a custom label. You can use static text and dynamic properties. Use the mustache picker
to select dynamic properties from the response data to use them as labels.For more information see How to use Custom Labels
Important note if you are using external API properties with hyphens for custom labels (Web API tile, Elasticsearch tile, Splunk tile)Property names that contain hyphens (for example
properties.name-with-hyphens) can't be processed due to a JavaScript limitation. If you want to use a property that contains a hyphen, you have two options:If you have access to the data source and can change the name of the property, change the name of the property to a name without hyphens.
For example, if your Elasticsearch query uses a property (an aggregation, a grouping or any other property you want to use) with a name that contains a hyphen, you can either access your Elasticsearch instance and change the name there or you can overwrite the name in the query dsl field.
If you can't change the name of the property, you need to enter the property name in the following format:
Original property name:
{{properties.name-with-hyphens.value}}New format:
{{properties['name-with-hyphens'].value}}
none By default, no sublabels are shown. Sort
Sort allows you to change the order of the results displayed. You can also group them by their characteristics.
default By default, the sorting of the blocks or icons depends on the data source. This can be alphabetical sorting or the order in which data comes back from an API request.
sort by
Sort by label or health state, ascending or descending
group by Group by label or health state, ascending or descending
Blocks
Here you can set the number of columns for the blocks, their height and the font size within the blocks.
Click done to save the tile.
The tile now shows data according to your search.
Tips for using the page timeframe in Splunk tiles
The page timeframe is the timeframe setting a dashboard
Using page timeframe means your search query will adapt to the dynamic page timeframe.
While being able to change the timeframe dynamically brings a lot of flexibility for showing data over different timeframes in the same tile, it can also mean that some page timeframe settings are not ideal for your intended search:
The tile shows no data because the current page timeframe is too short for the fixed time span in your search query. In this case, you can use the page timeframe instead of fixed values in the search query
Using the page timeframe in the search queryPossible scenario:
You want to avoid that it is possible to use a page timeframe shorter than the time span in the search query, because in that case the graph would show no results.Example:
This search uses a fixed time span of 1 day:Copysearch index=opp_events | timechart span=1d count by hostTimeframe setting: use page timeframe
When you set the page timeframe for the dashboard to "12 hours", the graph will be empty since there are no 24 hour results in the last 12 hours.
Solution:
Instead of using a fixed time span, use the page timeframe in your search query. You can use the mustache picker to insert page timeframe values.Example:
This search uses a dynamic span with page timeframe:CopySearch query: search index=opp_events | timechart span={{timeframe.isoDuration.startsWith("PT") ? '1h' : '1d'}} count by hostTimeframe setting: use page timeframe
The search now considers the currently set page timeframe. If the page timeframe is set to hours (like "last 12 hours"), it will search for results within a 1 hour span. If the page timeframe is set to anything else (like "last 6 months"), it will search for results within a 1 day span.
The loading time for the tile is very long because the current page timeframe is too long for the search query. In this case, you can use the page timeframe in the specific timeframe setting to put a cap on the page timeframe that can be used.
Using the page timeframe in the specific timeframe fieldPossible scenario:
You want to put a cap on the page timeframe that can be used, because if a search returns a lot of data, a long page timeframe like "last 6 months" would lead to long loading times.Solution:
Instead of setting the timeframe to use page timeframe, choose specific timeframe and create a limit for the page timeframe there. You can use the mustache picker to insert page timeframe values.Example:
timeframe setting: specific timeframeCopy{{timeframe.unixStart < Date.now()-(86400*7*1000) ? '-7d' : timeframe.isoStart}}This specific timeframe limits the page timeframe to 7 days. If the current page timeframe is set to "last 7 days" or anything shorter than that, the search uses the page timeframe. If the current page timeframe is longer (like "last 6 months"), the search will disregard the page timeframe setting and use "last 7 days" instead.
Using the scope in the timeframe setting
If you defined a scope, you can use the mustache picker to insert values that refer only to the defined scope.
Using the scope with fixed values
You can use fixed values for creating a specific timeframe that considers the scope.
Example:
You want to create a timeframe that considers how many items are in the scope. If there are less than 100 items, you want the timeframe to be 12 hours, if there are more than 100 items, you want the timeframe to be 1 day.
timeframe setting: specific timeframe
{{scope.length > 100 ? '-12h' : '-1d'}}
Using the scope with the page timeframe
You can use the dynamic page timeframe for creating a specific timeframe that considers the scope.
Example:
You want to create a timeframe that puts a cap on the page timeframe that can be used depending on the size of the scope. If the scope has more 100 items in it, you want the longest possible page timeframe setting to be 1 day (this means if the page timeframe is set to "last 12 hours", the page timeframe will be used, but if it is set to "last 6 months", this will be ignored and 1 day will be used). If the scope has less than 100 items in it, you want the timeframe to adjust to any page timeframe.
timeframe setting: specific timeframe
{{ timeframe.unixStart < Date.now()-(86400*1000) && scope.length > 100 ? '-1d' : timeframe.isoStart }}